BUSINESS CONTEXT, STRATEGY, AND PERFORMANCE
Financial Review


Despite a partial recovery from the COVID-19 pandemic, the year under review continued to be challenging. The experience of the last two years caused a paradigm shift in the insurance industry for customers around the world. Digitalization, new risks, and new demands are fundamentally changing the industry.
In this challenging environment, guided by Strategy Towards 2026, Saudi Re followed a client-centric approach and commitment to market development while following sustainable practices. Success of this approach is amply demonstrated in the results of operations and growth in business volumes recorded for the year.
2021 earnings were supported by an increase in the net underwriting income by 3.58%, while investment income grew by 25% creating a reasonable balance between the two revenue streams.
Saudi Re’s shareholder equity reached SR 964 million by the end of 2021 with an increase of 4.4% compared to the previous year. Additionally, the total assets grew by 11.18% to SR 3.12 billion, while our technical reserves stood at SR 1.6 billion as of 31 December 2021.
9.1 Revenue
Five year summary
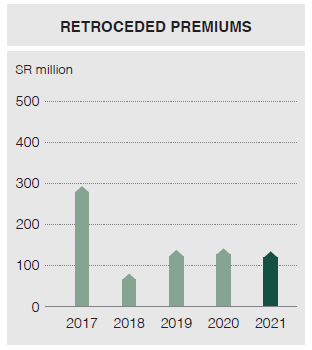
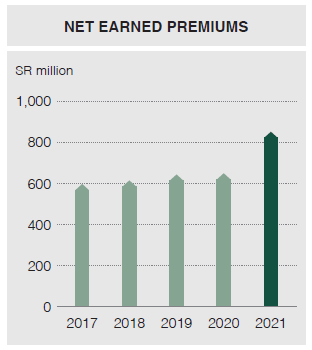

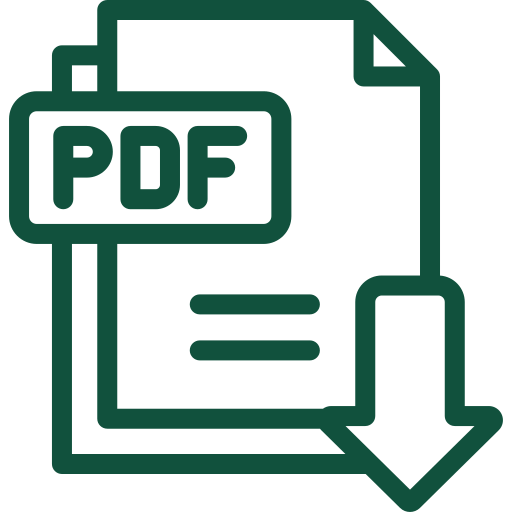
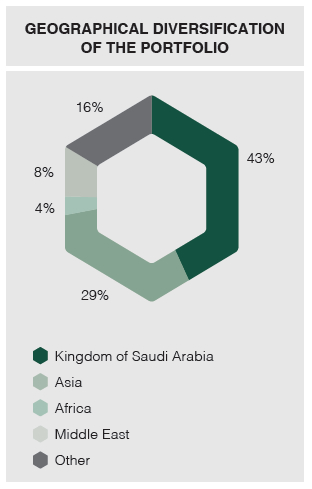
The Gross Written Premium (GWP) increased by 19% to SR 1,116 million in 2021, recording the highest premium level in the history of Saudi Re, which supported the building of scale. In the Saudi home market, a 39% growth in GWP was achieved. A promising 15% growth was registered in GWP in Asia, while business from Lloyd’s market grew by 13%. A healthy balance was maintained in the portfolio with international business contributing 57%. The combined result was an increase in the net written premiums by 24%. Total revenues increased by 32.52% from SR 660 million to SR 874 million.
Total comprehensive income for 2017-2021
| 2021 (SR ’000) | 2020 (SR ’ 000) | 2019 (SR ’000) | 2018 (SR ’000) | 2017 (SR ’000) | |
| Net income for the year | 38,309 | 45,918 | 45,444 | 13,722 | 38,888 |
| Other comprehensive income/loss | (2,124) | 2,191 | (3,021) | 3,036 | (1,962) |
| Total comprehensive income | 36,185 | 48,109 | 42,423 | 16,758 | 36,926 |
2021 witnessed unusual flood events in the Asian book of business and also challenging market practices affecting the performance of the Life book business, which resulted in an increase in the net claims incurred. This had a moderating impact on the growth of the underwriting income, resulting in the net underwriting income increasing by 3.6% to SR 71.63 million.
Key operational ratios for 2017-2021
| Ratio | 2021 % | 2020 % | 2019 % | 2018 % | 2017 % |
| Premium growth | 19 | 18 | 10 | -23 | -4 |
| Retention ratio | 85.9 | 83 | 82 | 85 | 68 |
| Net claims ratio | 66.1 | 61 | 65 | 66 | 70 |
| Net acquisition cost ratio | 25.5 | 29 | 25 | 26 | 23 |
| Technical ratio | 91.6 | 89 | 90 | 92 | 94 |
| G&A expense ratio | 7.50 | 8 | 8 | 8 | 9 |
| Combined ratio | 99.1 | 97 | 97 | 100 | 102 |
Saudi Re strengthened the loss reserves especially in the Life book of business and also in the Asian book of business which led to an increase in loss ratio of 5% compared with 2020. The latter was affected by exceptionally higher frequency flood claims. The acquisition cost ratio, which was unusually higher in the previous year, has come back to expected average.
9.2 Costs and expenses
Underwriting costs and expenses 2017-2021
| 2021 (SR ’000) | 2020 (SR ’000) | 2019 (SR ’000) | 2018 (SR ’000) | 2017 (SR ’000) | |
| Gross claims paid | (471,216) | (481,191) | (436,701) | (389,327) | (356,661) |
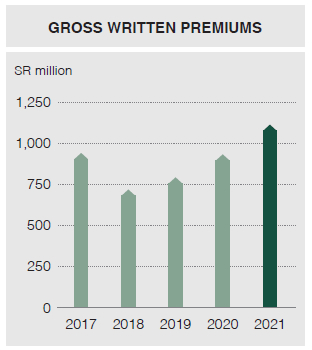
| Retroceded premiums | 61,707 | 181,476 | 60,006 | 24,638 | 63,396 |
| Net claims incurred | (565,312) | (391,980) | (417,070) | (404,054) | (419,114) |
| Policy acquisition costs and profit commissions | (232,404 | (194,682) | (172,781) | (172,472) | (146,126) |
| Other underwriting expenses | (5,063) | (4,002) | (3,616) | (1,997) | (4,710) |
| Total underwriting costs and expenses | (802,779) | (590,665) | (593,467) | (578,523) | (569,950) |
| Net underwriting income | 71,626 | 69,149 | 67,244 | 51,560 | 37,142 |
Investment income
| 2021 (SR ’000) | 2020 (SR ’000) | 2019 (SR ’000) | 2018 (SR ’000) | 2017 (SR ’000) | |
| Special commission income from time deposits | 5,312 | 10,729 | 18,325 | 5,824 | 3,649 |
| Realized gain/(loss) on investments held at fair value through income statement | 7,209 | (885) | 13,903 | 678 | 1,339 |
| Unrealized gains on investments held at fair value through income statement | 4,912 | 1,685 | 3,793 | 3,460 | 49,948 |
| Special commission income from bonds and sukuk | 13,548 | 11,427 | 4,156 | 2,874 | 2,688 |
| Special commission expense from margin loan | (432) | 10 | – | – | – |
| Dividend income | 1,092 | 3,310 | 1,862 | 3,419 | 4,637 |
| Share of profit of equity-accounted investee | 18,658 | 12,072 | 5,115 | 2,303 | 165 |
| Investment management expenses | (3,356) | (889) | (1,675) | (3,920) | (9,451) |
| Net investment income | 46,944 | 37,439 | 45,479 | 14,638 | 52,975 |
Saudi Re managed to register a sustained performance over the past five years, with improved profit margins.
In 2021, the net claims incurred increased by 43.71% from SR 391.98 million to SR 561.31 million. This was influenced by reserve strengthening and higher than expected frequency of flood claims. Total underwriting costs and expenses increased by 35.91%. This offset the increase in total revenues to a greater extent and as a result, the net underwriting income increased only by 3.58% to SR 71.63 million.
Other operating income, administrative expenses, and Zakat did not record major changes compared to 2020.
The net income is diversified between the operating income and the investment income in the proportion of 54% and 46%, indicating balance in revenue streams.
9.3 Assets
Assets for the period 2017-2021
| 2021 (SR ’000) | 2020 (SR ’000) | 2019 (SR ’000) | 2018 (SR ’000) | 2017 (SR ’000) | |
| Bank balances and cash | 27,807 | 13,157 | 13,169 | 31,886 | 33,482 |
| Time deposits | 243,382 | 193,459 | 378,031 | 270,132 | 109,753 |
| Accrued special commission income from time deposits | 2,310 | 3,211 | 7,974 | 2,080 | 872 |
| Reinsurance premiums receivable, net | 242,230 | 293,755 | 233,392 | 200,024 | 358,871 |
| Investments held at fair value through income statement | 631,608 | 512,081 | 417,848 | 552,574 | 865,068 |
| Held-to-maturity investments | 298,022 | 184,023 | 37,500 | 0 | 0 |
| Accrued special commission income from bonds, sukuk and held-to-maturity investments | 6,810 | 6,181 | 2,793 | 2,664 | 3,831 |
| Accrued reinsurance premiums | 680,470 | 594,263 | 467,071 | 409,778 | 372,088 |
| Retrocession balances receivable | 13,064 | 29,509 | 11,744 | 11,432 | 14,300 |
| Retroceded share of unearned premiums | 67,953 | 71,862 | 50,837 | 33,081 | 117,679 |
| Deferred excess of loss premiums | 12,050 | 12,784 | – | – | – |
| Retroceded share of outstanding claims | 149,333 | 154,674 | 282,719 | 198,433 | 59,889 |
| Retroceded share of claims incurred but not reported | 38,033 | 45,796 | 34,812 | 59,937 | 105,950 |
| Deferred policies costs | 168,598 | 149,403 | 106,279 | 99,896 | 100,345 |
| Held-to-maturity investments | 0 | 0 | 0 | 0 | 0 |
| Prepaid expenses, deposits and other assets | 246,581 | 289,099 | 244,640 | 208,959 | 104,193 |
| Due from shareholders’ operations | 0 | 0 | 0 | 0 | 0 |
| Property and equipment, net | 37,156 | 33,625 | 33,576 | 32,589 | 33,536 |
| Investment in an equity-accounted investee | 142,000 | 120,141 | 101,446 | 97,294 | 91,954 |
| Statutory deposit | 89,100 | 81,000 | 121,500 | 121,500 | 100,000 |
| Accrued income on statutory deposit | 20,962 | 20,186 | 17,992 | 15,549 | 13,128 |
| Total reinsurance operations assets | 3,117,469 | 2,808,210 | 2,563,323 | 2,347,806 | 2,484,938 |
Total assets increased by 11.18% to SR 3.12 billion as at 31 December 2021. Saudi Re has generated 239 million in operating cash inflow compared with 15 million in 2020, a growth of 1,598% that has a positive impact in invested assets as well as total assets. There were increases in time deposits, investments held at fair value, held-to-maturity investments, and accrued reinsurance premiums. On the other hand, there were declines in net reinsurance premiums receivable, prepaid expenses, and deposits.
Significantly, there has been an increase in all categories of investments. Saudi Re has demonstrated strong financial flexibility with non-existent leverage and good access to capital markets. Saudi Re’s strong asset quality is demonstrated by its investment portfolio, which minimizes risk. Saudi Re’s asset quality is considered to be on a par with that of an A-rated company.
9.4 Liabilities
Liabilities for the period 2017-2021
| 2021 (SR ’000) | 2020 (SR ’000) | 2019 (SR ’000) | 2018 (SR ’000) | 2017 (SR ’000) | |
| Accounts payable | 44,042 | 31,975 | 39,929 | 19,928 | 16,648 |
| Margin loan payable | 56,797 | 23,117 | – | – | – |
| Retrocession balances payable | 48,772 | 77,220 | 46,173 | 22,899 | 229,764 |
| Accrued retroceded premiums | 35,492 | 39,812 | 21,741 | 15,840 | 7,891 |
| Unearned premiums | 648,869 | 548,541 | 401,998 | 380,171 | 461,489 |
| Outstanding claims | 782,991 | 716,947 | 737,229 | 662,467 | 445,954 |
| Claims incurred but not reported | 427,397 | 350,742 | 355,255 | 330,481 | 415,099 |
| Unearned retrocession commission | 17,150 | 15,805 | 8,396 | 6,410 | 7,542 |
| Accrued expenses and other liabilities | 29,897 | 23,861 | 19,421 | 12,547 | 12,813 |
| Employees’ end of service benefits | 12,288 | 10,673 | 8,829 | 6,594 | 5,729 |
| Provision for Zakat and tax | 15,266 | 15,174 | 23,742 | 38,244 | 37,431 |
| Accrued commission income payable to SAMA | 20,962 | 20,186 | 17,992 | 15,549 | 13,128 |
| Total liabilities | 2,139,923 | 1,874,052 | 1,680,705 | 1,511,130 | 1,653,489 |
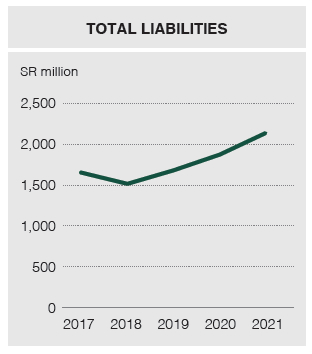
The liabilities increased from SR 1,874 million to SR 2,141 million, an increase of 14.24% following the growth in business by 19%. There have been significant increases in the technical reserves comprising unearned premiums, outstanding claims, and claims incurred but not reported.
9.5 Equity
The paid up share capital of the Company increased to SR 891,000 from SR 810,000. The capital increase occurred through a bonus share issue.
9.6 Net income
Net income from shareholders’ operations and reinsurance operations 2017-2021
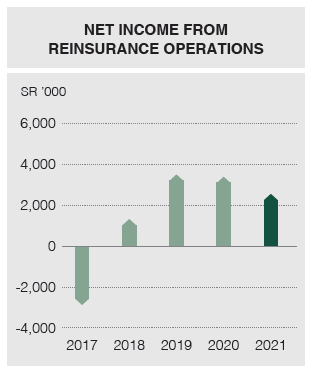
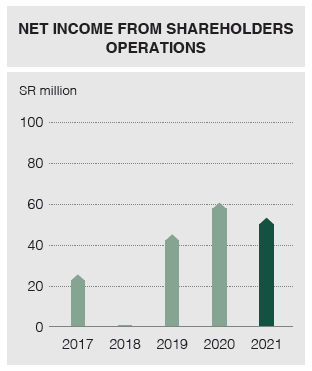
| 2021 (SR ’000) | 2020 (SR ’000) | 2019 (SR ’000) | 2018 (SR ’000) | 2017 (SR ’000) | |
| Net income from reinsurance operations | 2,571 | 3,432 | 3,518 | 1,371 | (2,828) |
| Net income from shareholders operations | 53,315 | 60,692 | 45,444 | 819 | 25,454 |
Details for 2020 and 2021
| 2021 (SR ’000) | 2020 (SR ’000) | YoY % Change | |
| Total income for the year before Zakat and tax | 55,886 | 64,124 | -12.8 |
| Total income attributed to the reinsurance operations | (2,571) | (3,432) | 25.1 |
| Net income for the year before Zakat and tax attributable to the shareholders | 53,315 | 60,692 | -12.2 |
| Zakat and tax charge for the year | (15,006) | (14,774) | 1.6 |
| Net income for the year after Zakat and tax attributable to the shareholders | 38,309 | 45,918 | -16.6 |
| Basic and diluted earnings per share for the year | 0.43 | 0.52 | -17.3 |
The reason for the decrease in net profit during the current year compared to the previous year is mainly due to the increase in claims incurred by 44%.
9.7 Dividend Distribution Policy
To achieve suitable returns to the Company’s shareholders in one or more of the following:
- Distribution of cash dividends to the shareholders taking into consideration the financial position of the Company, solvency margin requirements, available credit lines, and the general economic situation.
- Stock dividends taking into consideration the requirements and conditions related to retained earnings and other stockholders’ equity in the balance sheet.
- Shareholders who are registered at the end of trading before the General Assembly at which dividend preeminent is approved will be entitled for the dividends.
- The Company pays the profits to be distributed to the shareholders at the dates specified by the Board of Directors. According to the Articles of Association of the Company, profits are distributed according to the decision of the General Assembly, and this is done as follows:
- Set aside Zakat and assessed income tax.
- Set aside 10% of the profit to form a statutory reserve and the Ordinary General Assembly may stop this appropriation when the total reserve reaches 30% of the paid-up capital.
- Once determining the stock shares in net profits, the Ordinary General Assembly has the right to form other reserves, to the extent that it achieves the interest of the Company or ensured distribution of fixed profits to shareholders.
- After that, the first payment shall be distributed to the shareholders, with the condition that it is not less than 1% of the paid-up capital.
The Board decided not to distribute cash dividends for 2021.
On 14 July 2021, the Extraordinary General Assembly agreed in its meeting on the following:
Bounce Shares distribution to the shareholders of the Company registered in the Securities Depository Center records at the end of the day of the General Assembly Meeting, at the rate of one share for every 10 shares. The shares were transferred to the accounts of eligible shareholders through the Bank as of 18 July 2021.
The Company has generated SR 239 million in operating cash inflow compared with SR 15 million in 2020, a growth of 1,598% that has a positive impact on invested assets as well as total assets.
9.8 Zakat, income tax-2021, fees, and other charges
| Description | Reasons | Paid amount SR ’000 | Outstanding amount at end of financial period SR ’000 |
| Zakat and income tax | The Company’s share according to Zakat and tax regulations in the Kingdom | 14,913 | 15,266 |
| WHT | The Company’s share according to Zakat and tax regulations in the Kingdom | 3,033 | 199 |
| VAT | The Company’s share according to Zakat and tax regulations in the Kingdom | 43,484 | 9,638 |
| SAMA fees | Supervision fees for the Central Bank of Saudi Arabia | 5,956 | 3,303 |
| GOSI | Social insurance contributions for Company employees to the General Organization for Social Insurance | 2,484 | 205 |
9.9 Solvency and rating
As a company licensed by the Saudi Central Bank (SAMA), Saudi Re operates under the supervision of SAMA and is in full compliance with the applicable regulations. The Company maintained a solvency ratio of 163% as at 31 December 2021 and is rated A3 (Stable) by Moody’s.